Reformat/adapt Blast XML results against a custom UniProt sequence database to generate a species distribution chart
Problem: Empty species distribution chart
Solution: Reformat your SwissProt/UniProt blast XML results
The species distribution chart is a good way to visualise the species found for all blast hits for a given dataset. It is possible to generate this chart with OmicsBox from the toolbar: functional analysis > Charts and Statistics > Blast Statistics > Species Distribution.
This chart can only be generated if the species information is provided in the Blast Hit description line in a specific way. 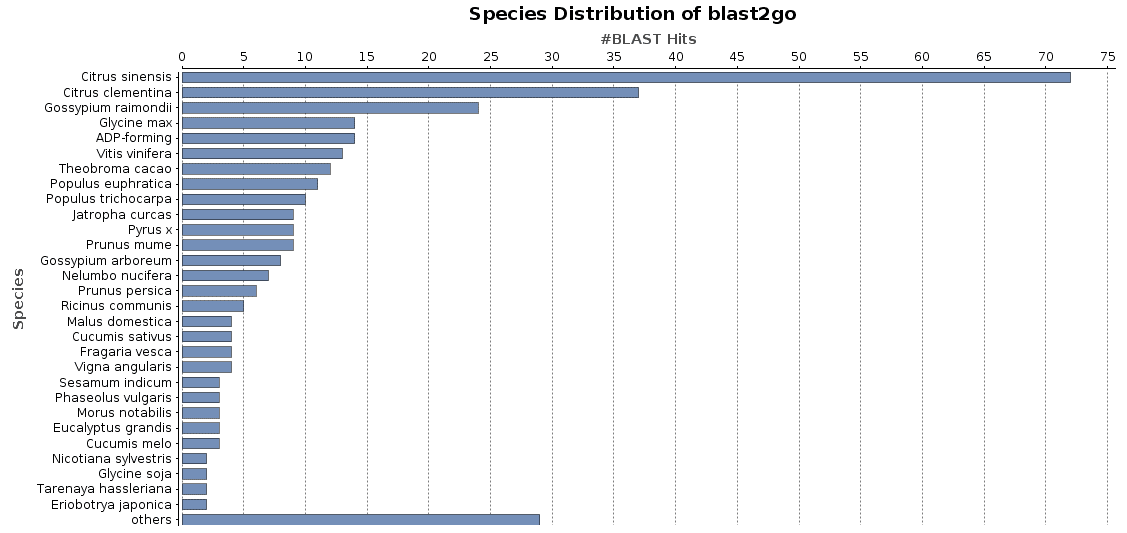
This tutorial explains how to reformat XML (not XML2 nor JSON) blast results which have been obtained with a custom blast database generated from UniProt/SwissProt sequences.
A blast database generated/formatted based on UniProt/SwissProt sequences will provide species information in a different format than a preformatted NCBI Blast database. OmicsBox needs this NCBI species format to generate a correct, blast-based species distribution chart. NCBI provides the species information between square brackets “[]” and Uniprot puts it after the tag OS= in the blast hit description.
NCBI Format:
<Hit_num>1</Hit_num>
<Hit_id>gi|568859934|ref|XP_006483485.1|</Hit_id>
<Hit_def>PREDICTED: early nodulin-like protein 3-like [Citrus sinensis]</Hit_def>
<Hit_accession>XP_006483485</Hit_accession>
<Hit_len>181</Hit_len>
UniProt Format:
<Hit_num>1</Hit_num>
<Hit_id>TR:V4U0L5_9ROSI</Hit_id>
<Hit_def>gnl|V4U0L5| Uncharacterized protein OS=Citrus clementina GN=CICLE_v10008136mg PE=4 SV=1</Hit_def>
<Hit_accession>TR:V4U0L5_9ROSI</Hit_accession>
<Hit_len>388</Hit_len>
In order to draw the species distribution within OmicsBox using the Uniprot/Swissprot blast results, there is the need to reformat the blast results. In Linux with the sed command, it is possible to reformat them by replacing the OS= with square brackets.
sed -E 's/<Hit_def>(.*)OS=([A-Za-z\.\-\,\_ ]+)(( [A-Z]+=.*)|)<\/Hit_def>/<Hit_def>\1[\2]\3<\/Hit_def>/g' final_blastx_results.xml > final_blastx_species.xmlThe result after running the sed command:
<Hit_num>1</Hit_num>
<Hit_id>TR:V4U0L5_9ROSI</Hit_id>
<Hit_def>gnl|V4U0L5| Uncharacterized protein [Citrus clementina] GN=CICLE_v10008136mg PE=4 SV=1</Hit_def>
<Hit_accession>TR:V4U0L5_9ROSI</Hit_accession>
<Hit_len>388</Hit_len>
Once the XML file has been reformatted, you can load it into OmicsBox and do the species distribution from the toolbar: functional analysis > Charts and Statistics > Blast Statistics > Species Distribution.


